SunGrid · 2024 · Web · Dashboard · Energy
Solar monitoring that calms operators down.
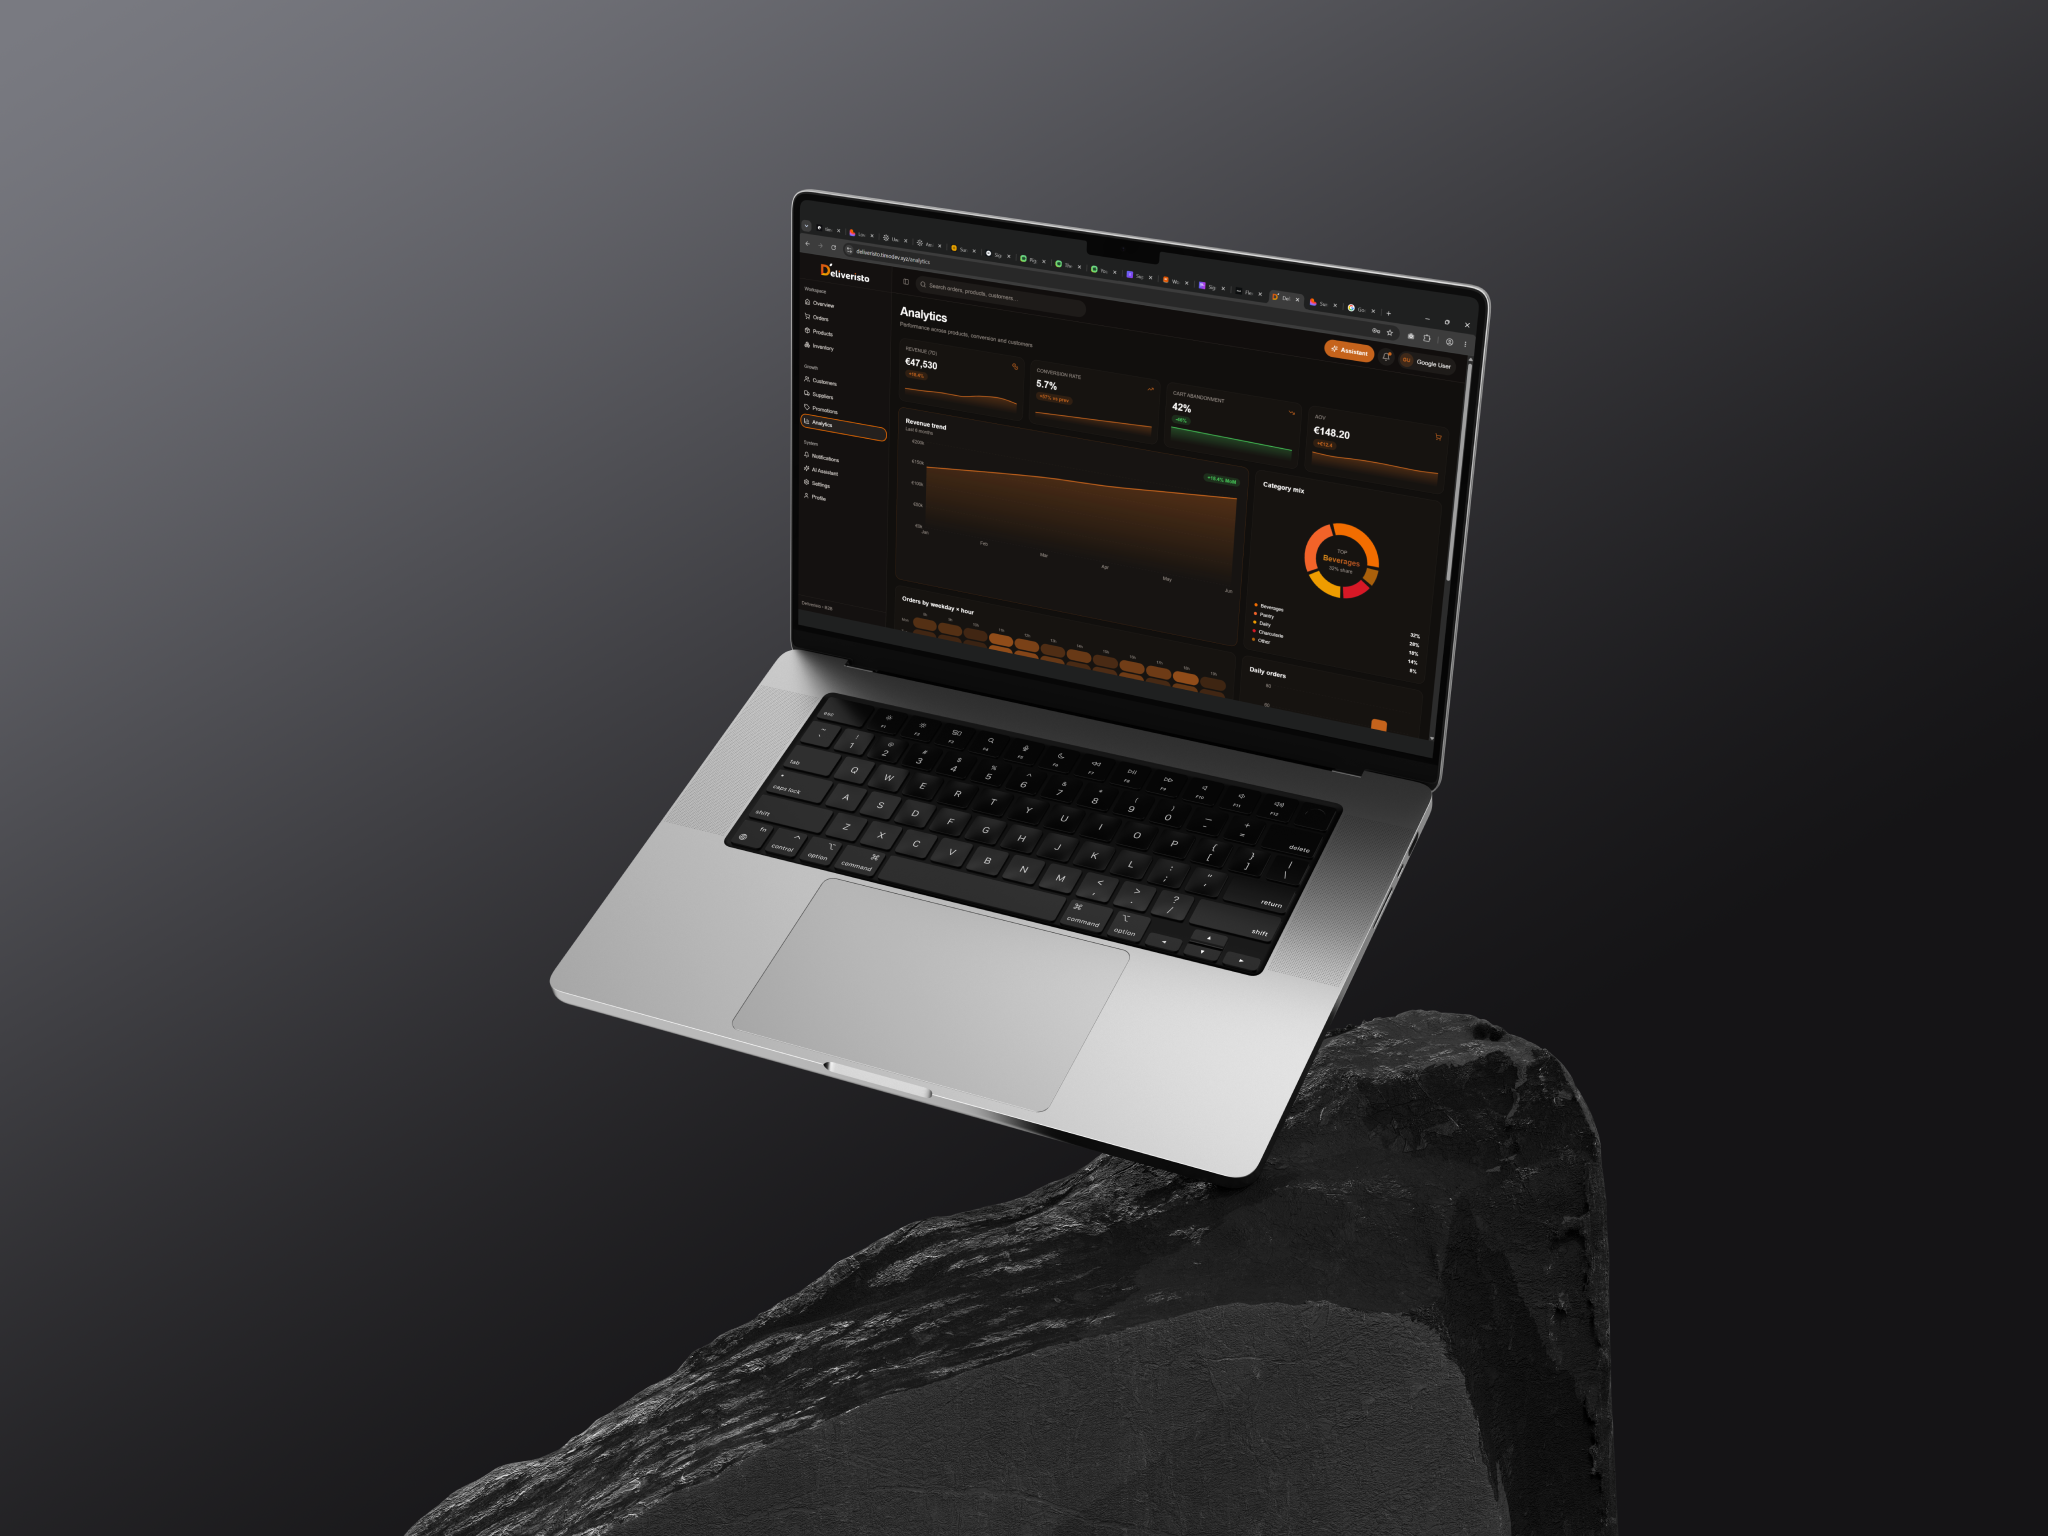
A monitoring dashboard for solar operators — production, inverters and batteries surfaced in a calm, glanceable interface.
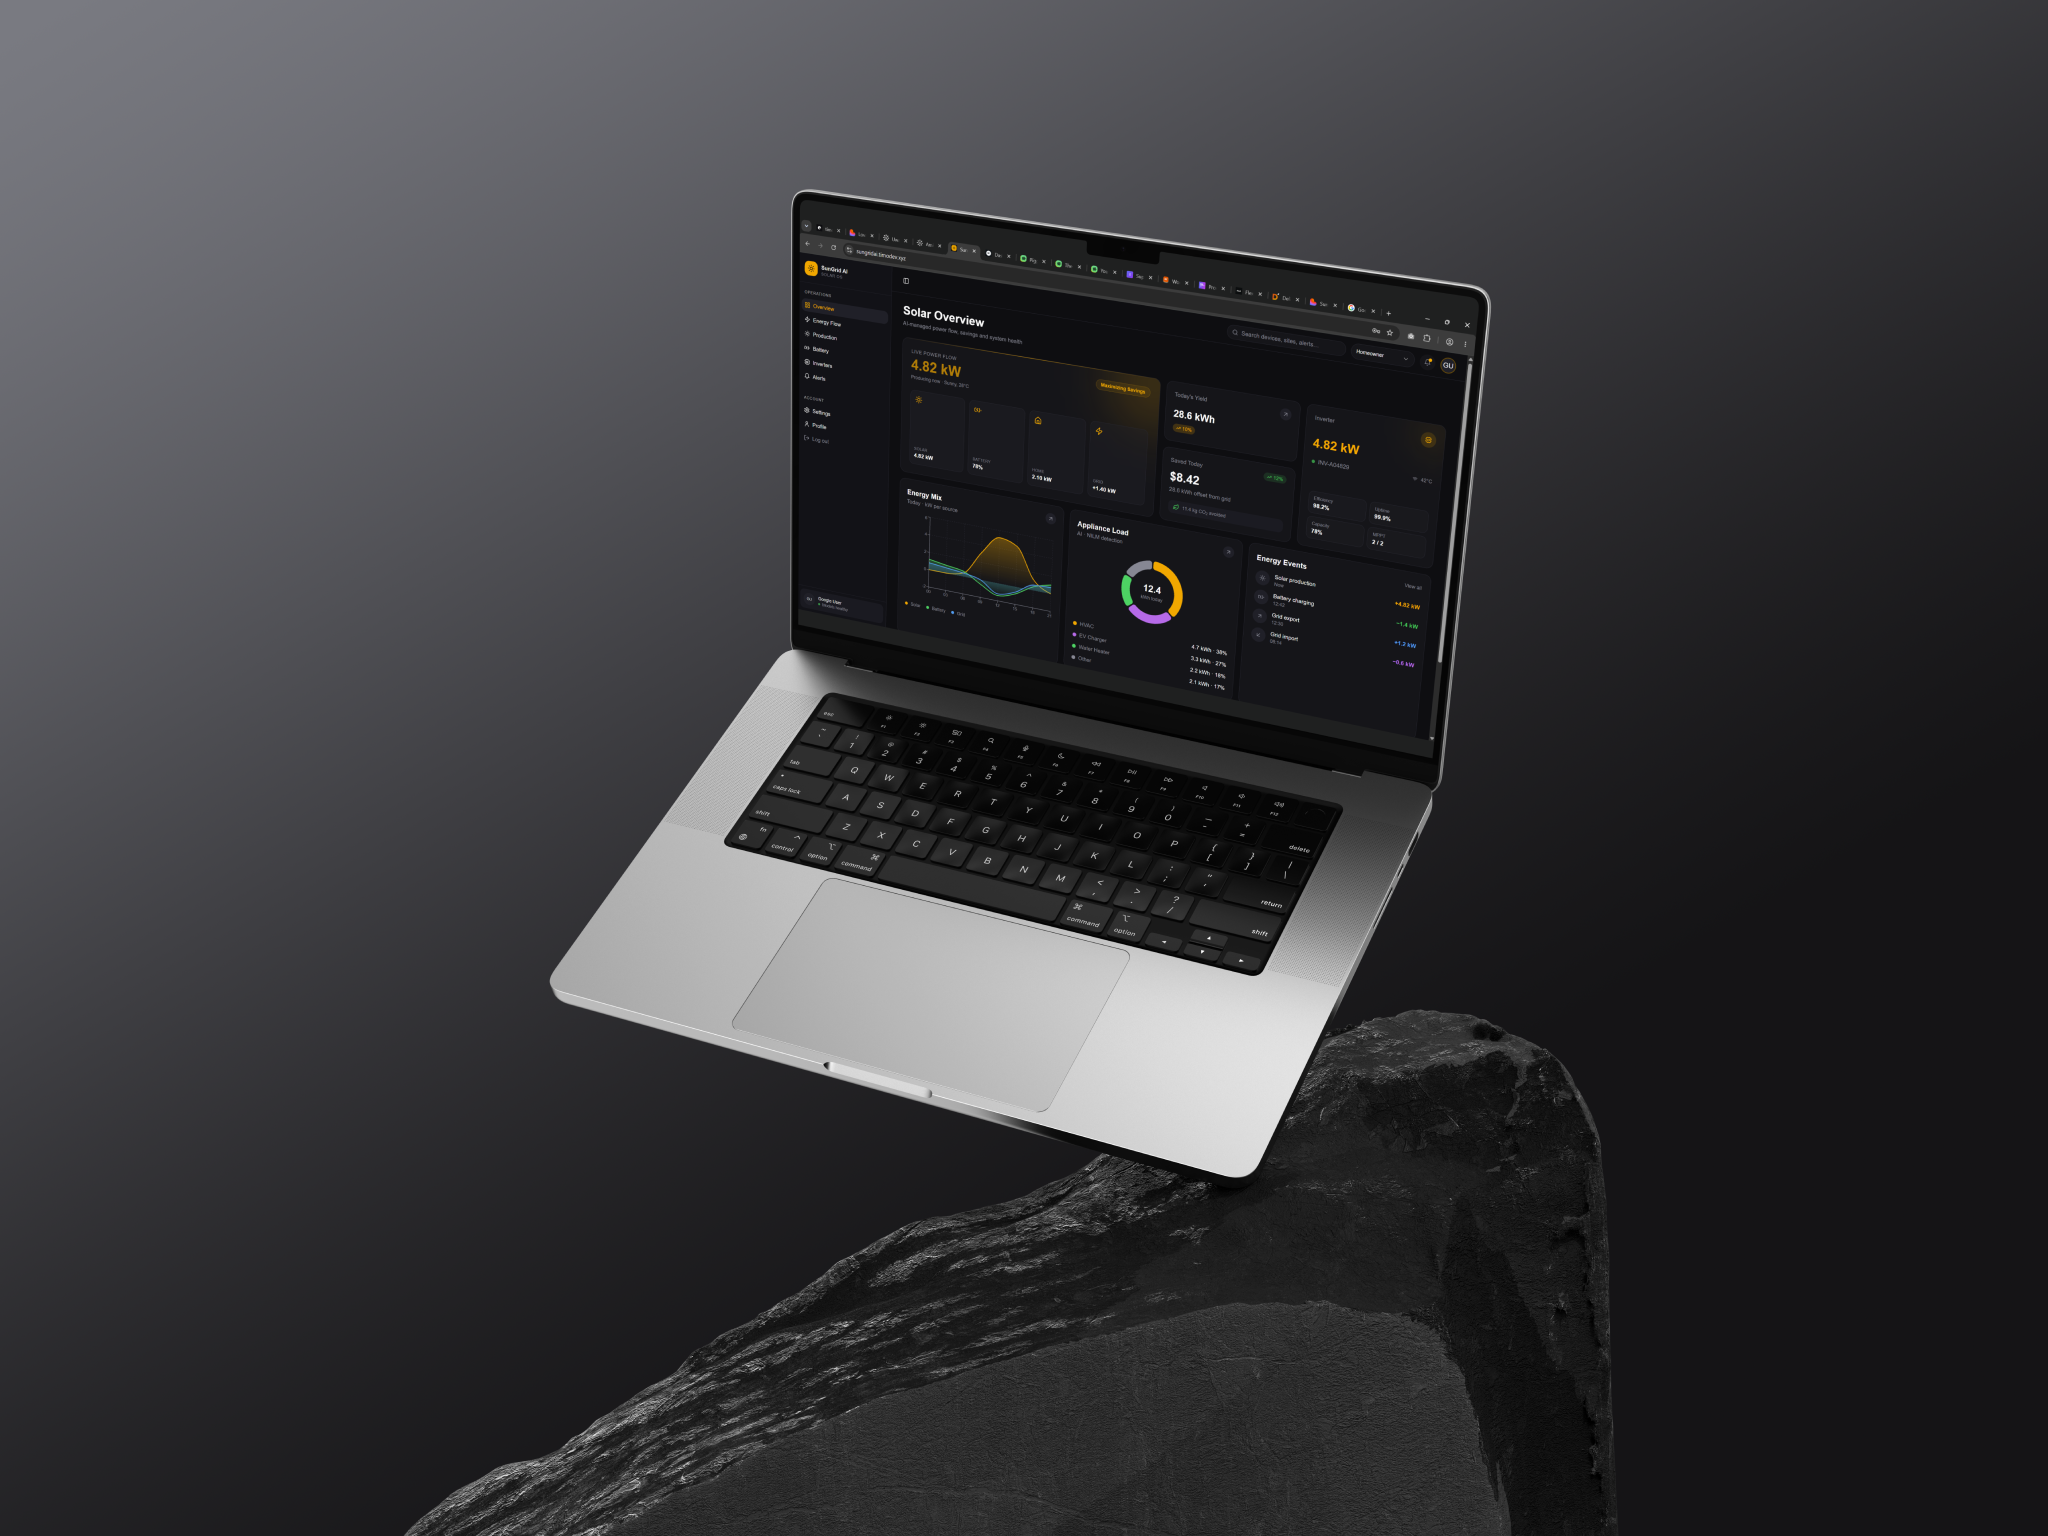
SunGrid gives operators a clear, glanceable read on every site they manage — production, inverters, batteries — without forcing them to chew through telemetry.
The Problem
Operators were drowning in raw telemetry and switching between tools to triage one issue.
The Goal
Consolidate site health into one calm dashboard with clear, fast comprehension of production, hardware and storage state.
Role
Product Designer
0
Surfaces consolidated
0
Core views
Operators
Audience
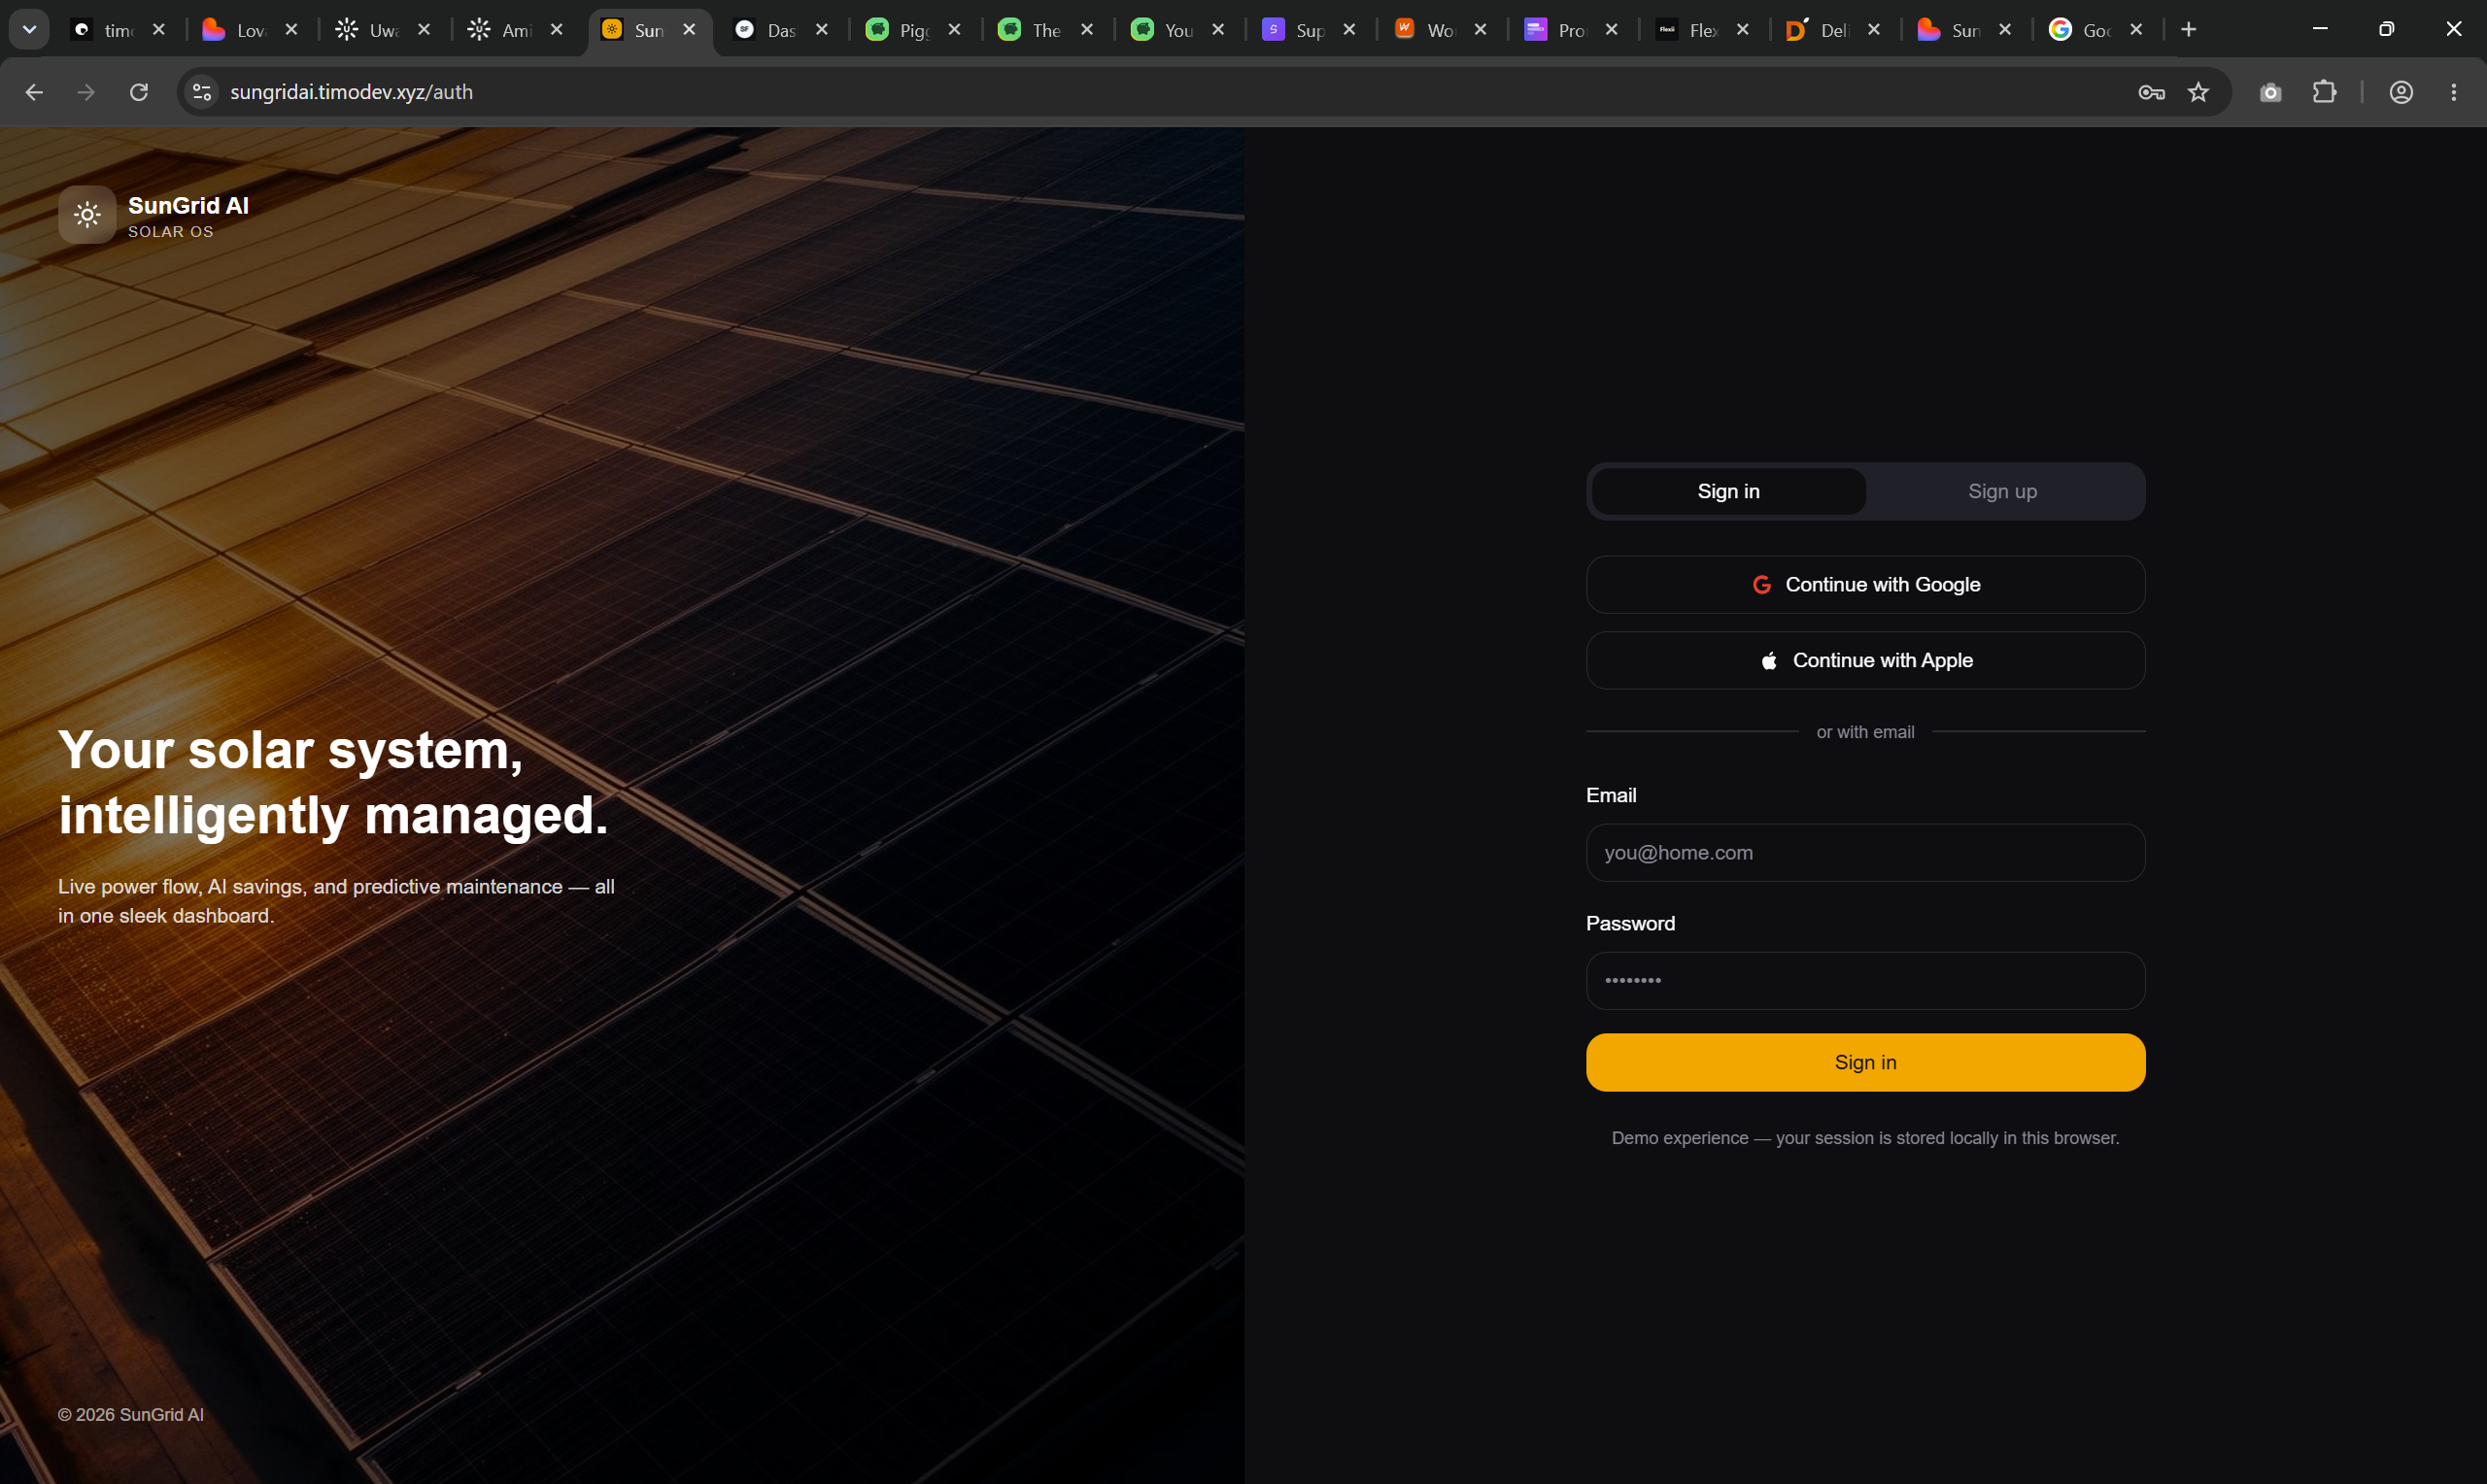
- 01Designed authentication and role-based access
- 02Designed the overview, production, inverter and battery views
- 03Defined visual language for time-series data
01
Confident sign-in
Auth designed for operators who log in every shift.
02
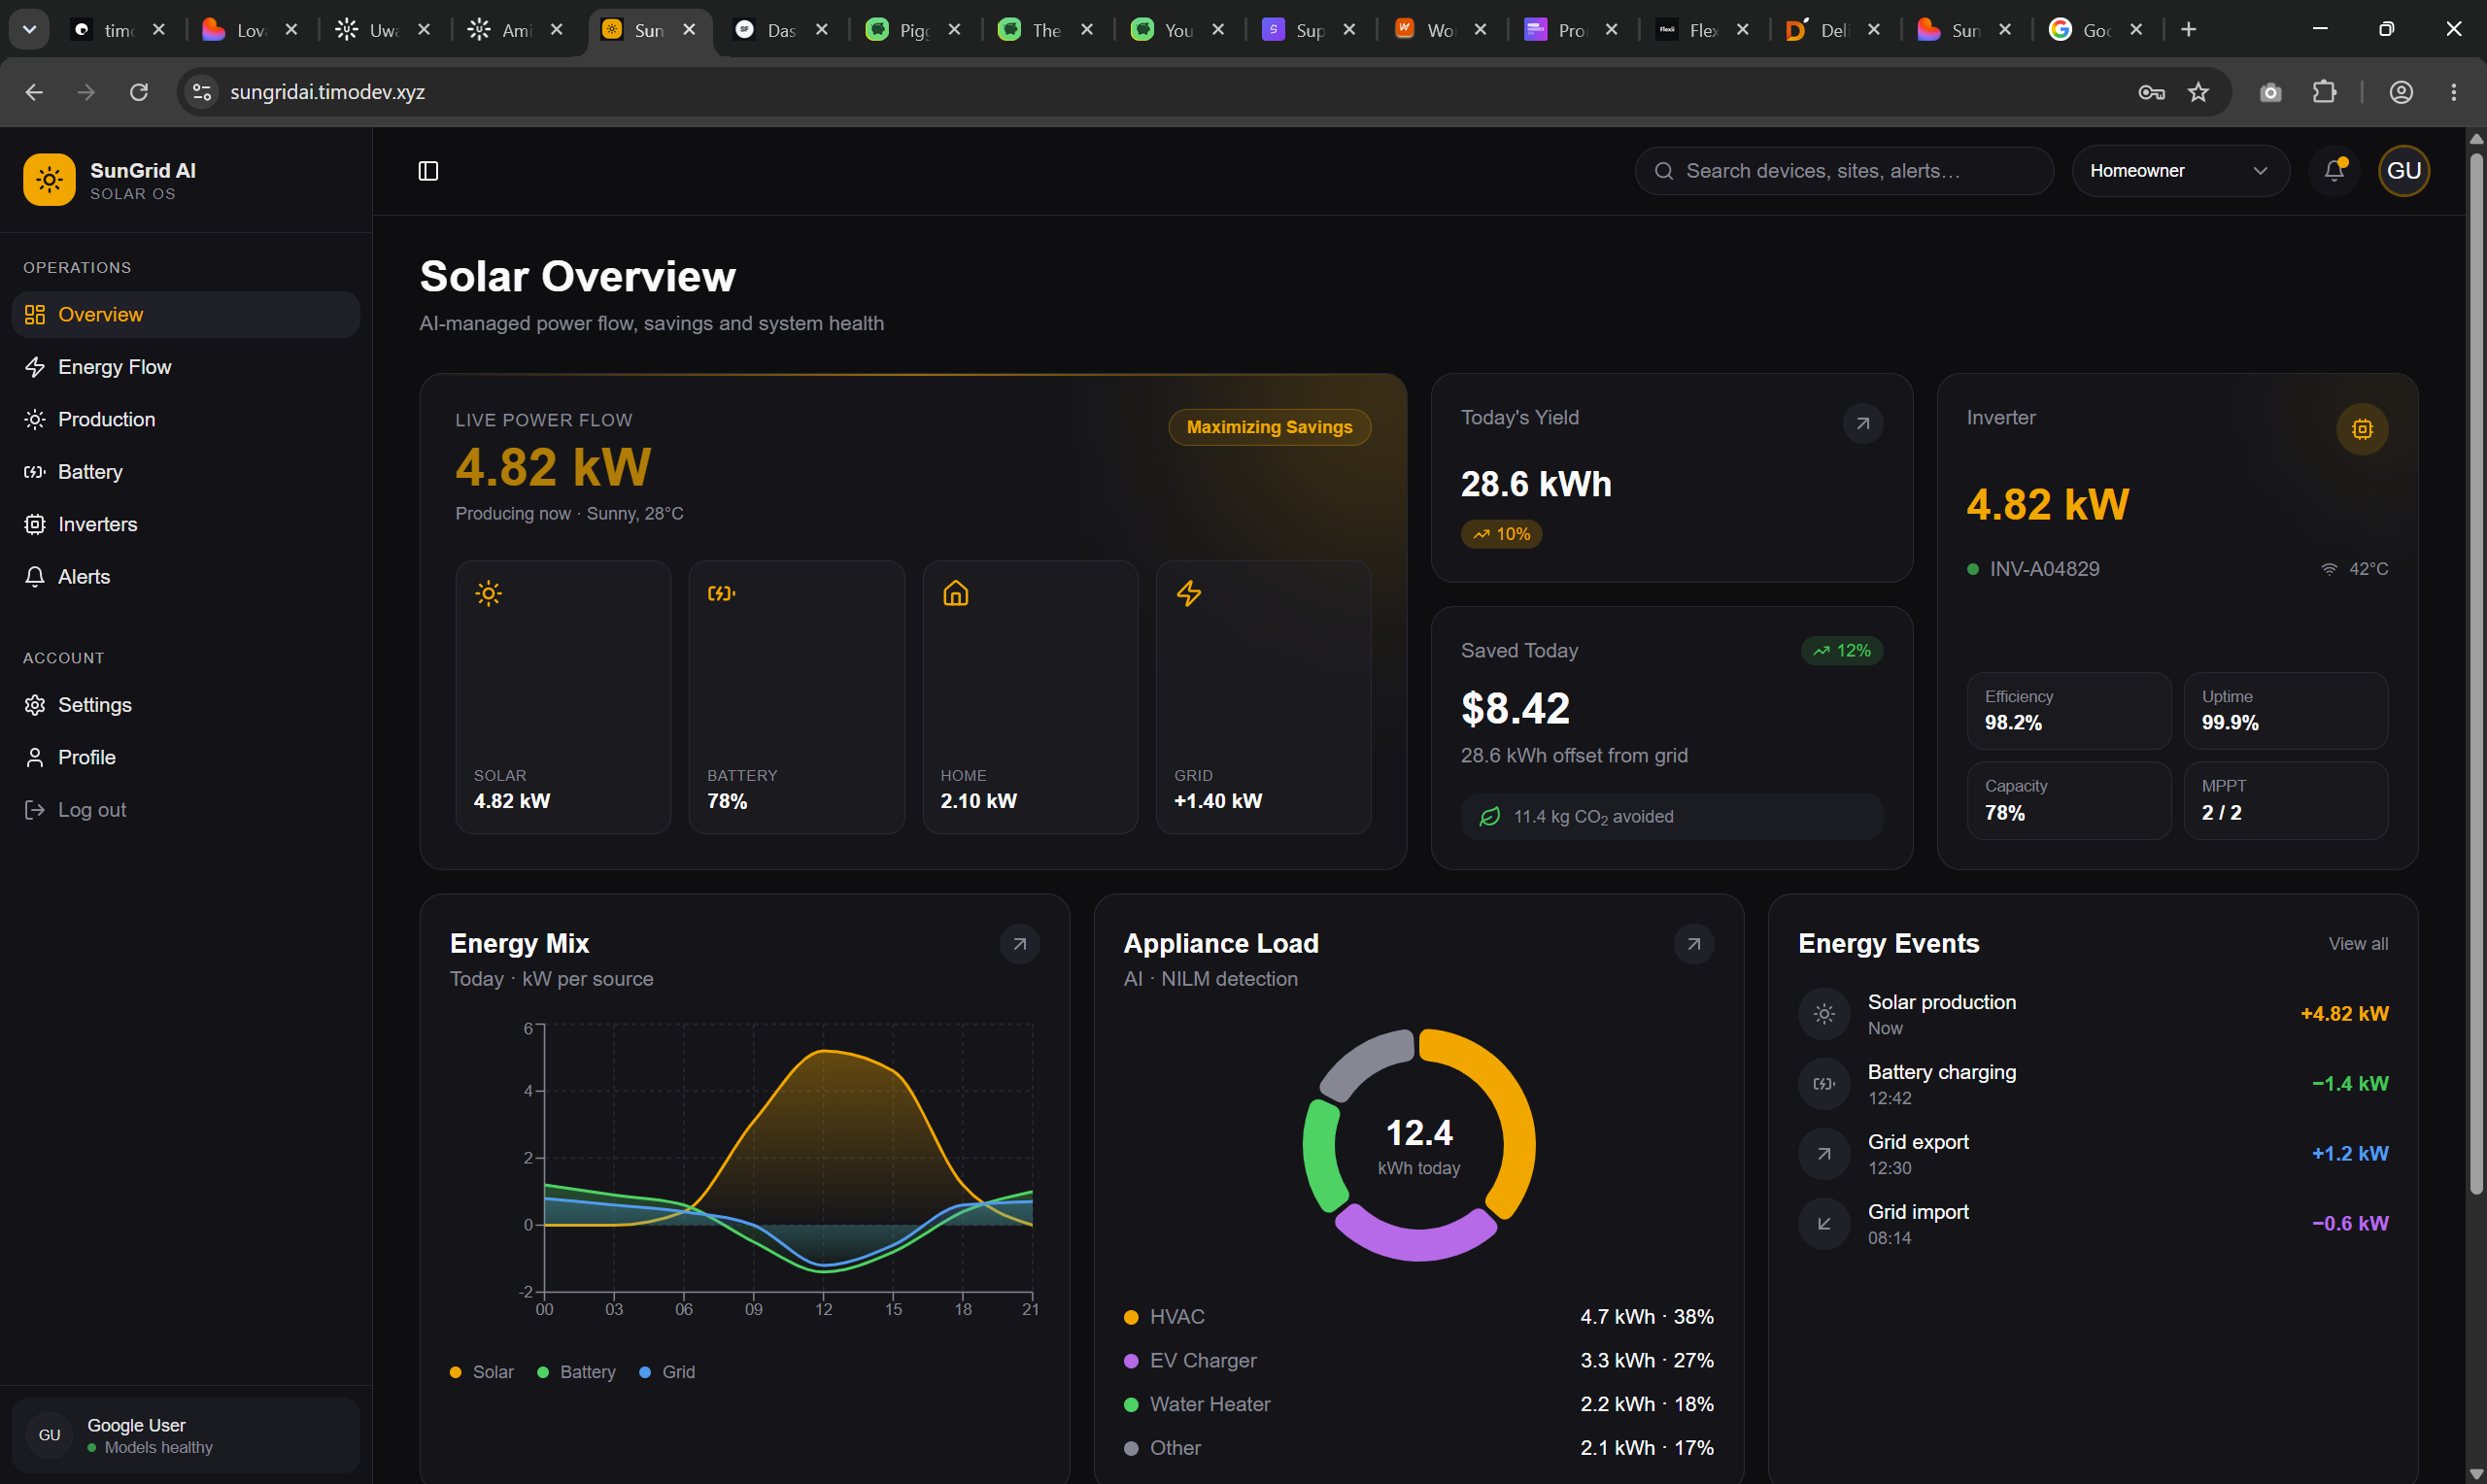
Overview
Site health at a glance — what's healthy, what needs attention.

03
Production
Time-series production made readable, not noisy.
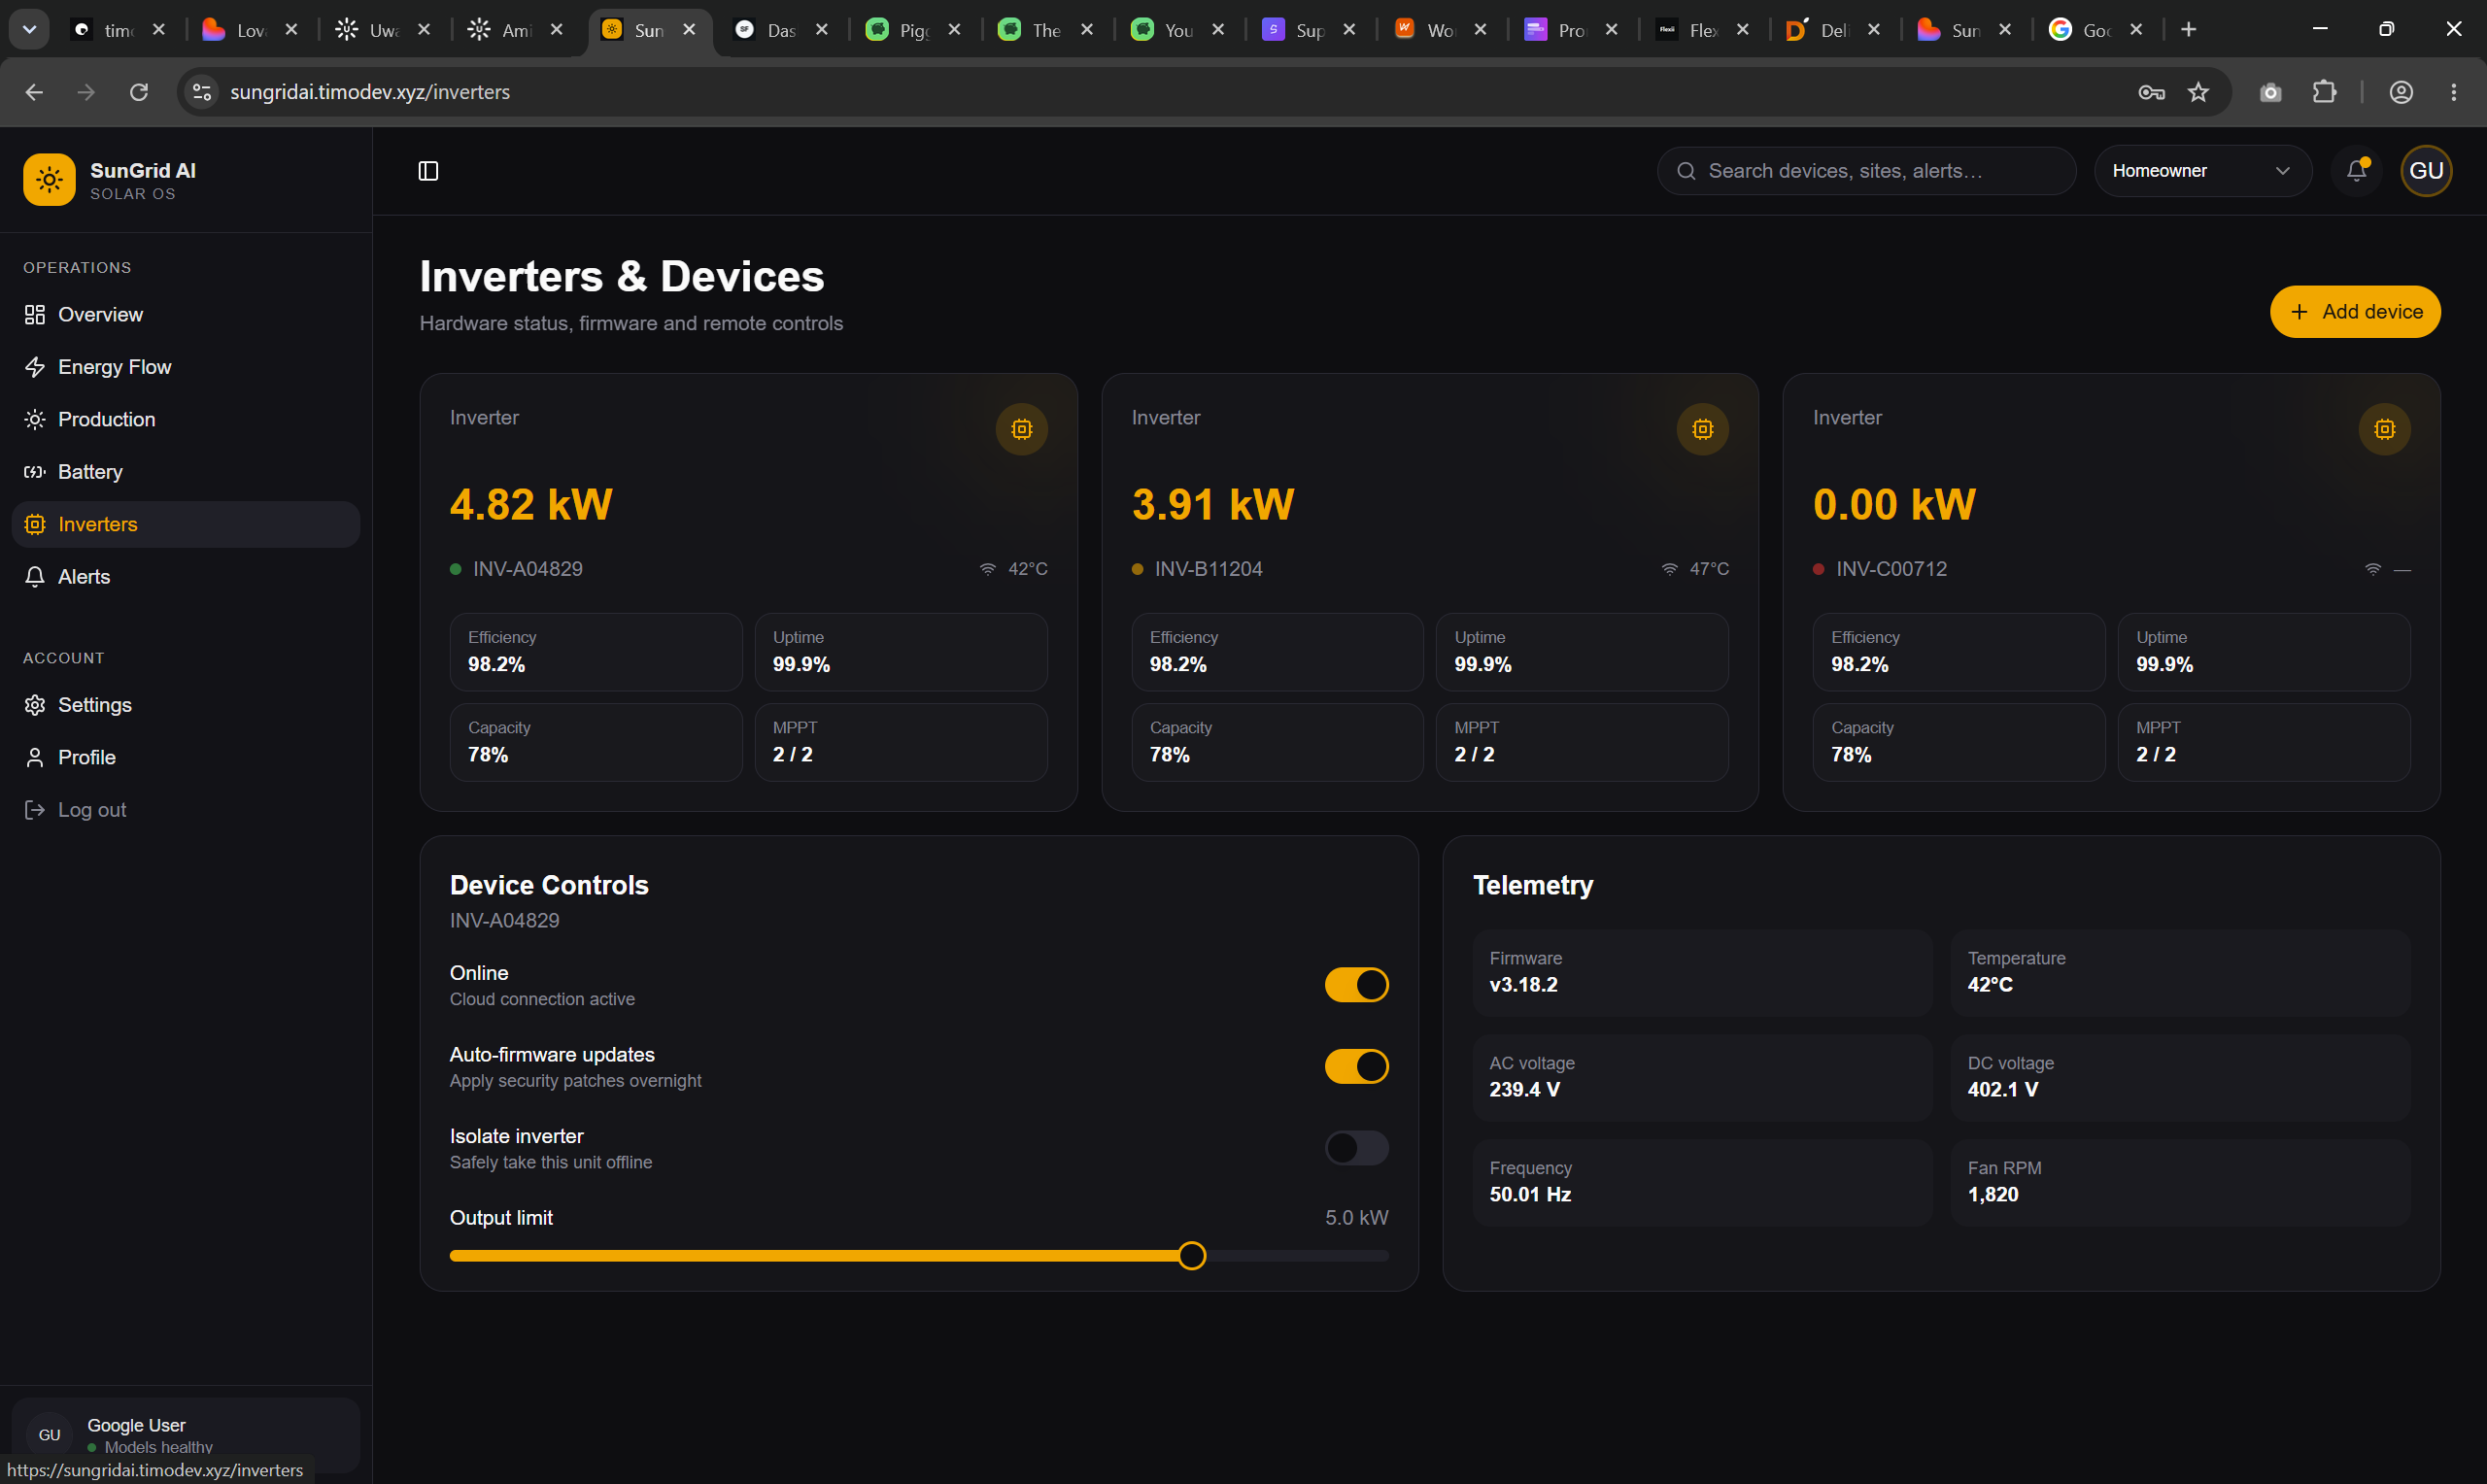
04
Inverters
Per-inverter status with clear failure paths.
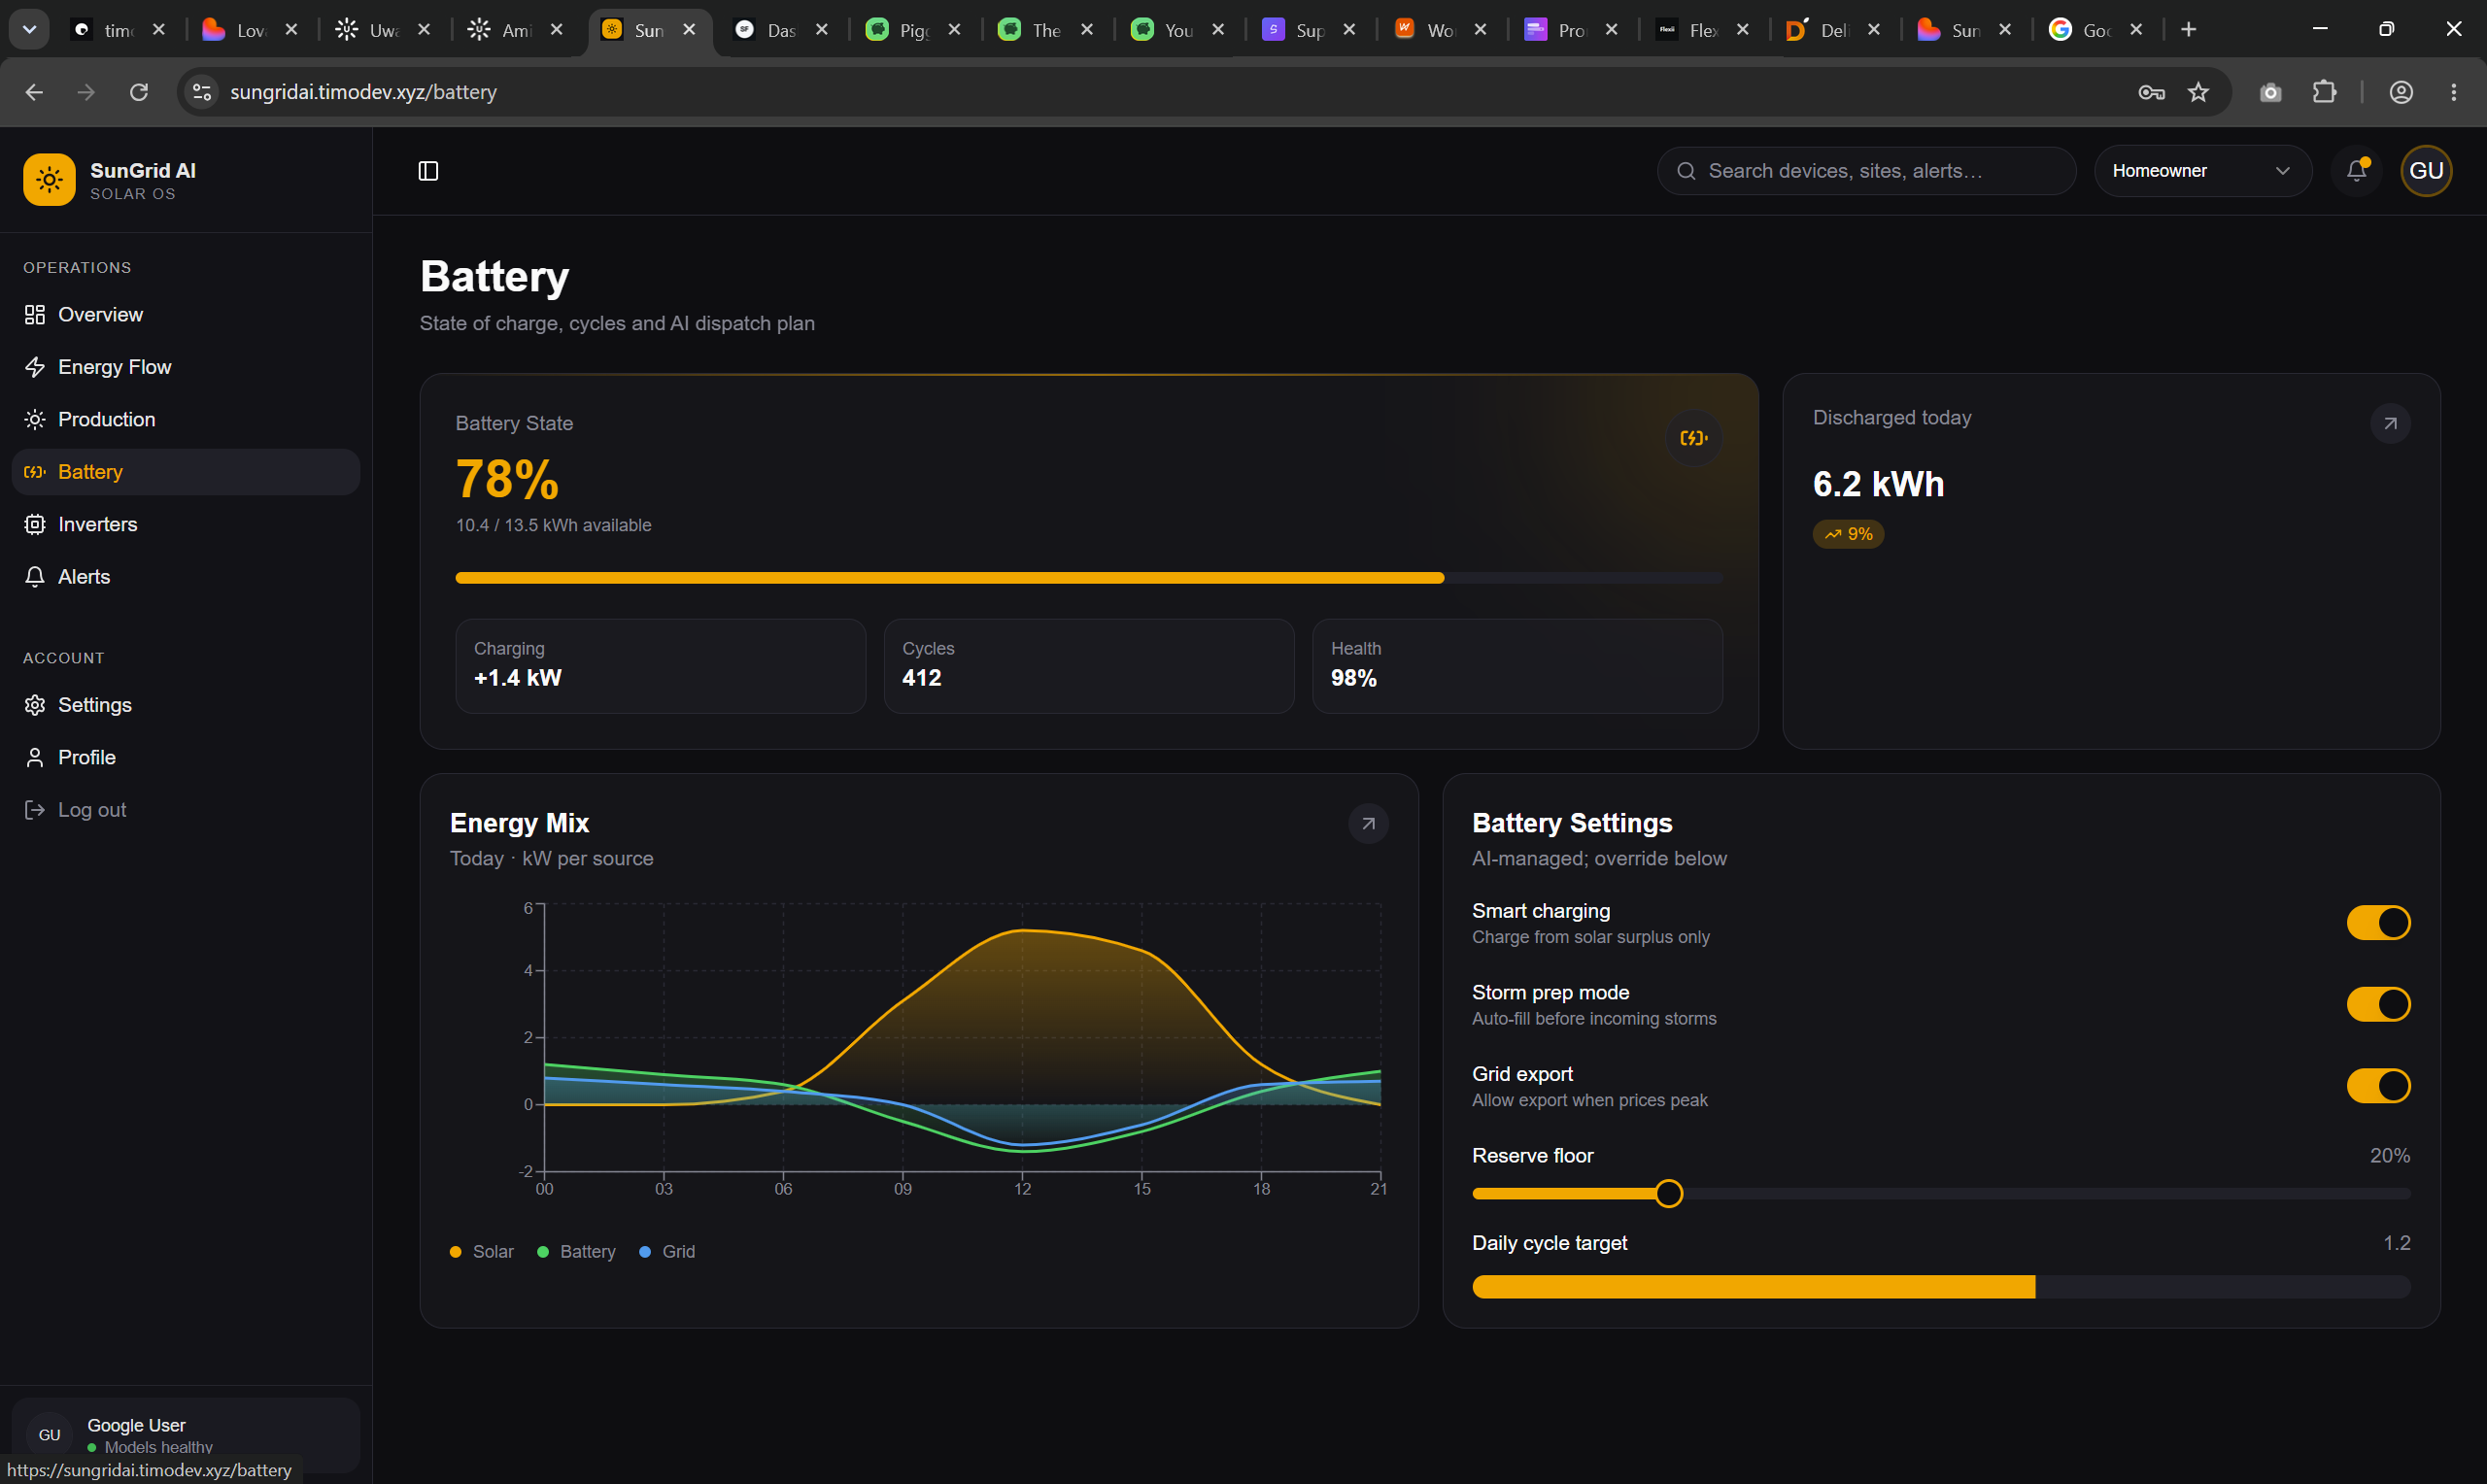
05
Battery
State-of-charge, throughput and warnings in one view.
A single calm console replaced multiple tabs and stitched data sources, cutting the time operators spent triaging routine issues.
Takeaways
Dashboards for operators must reward a glance, not a study session. Defaults and ordering matter more than features.
Impact
- 01One console replaced multiple tools for daily triage
- 02Faster comprehension of site health
- 03Clearer failure paths for hardware issues
What I learned
Defaults are the product for ops tooling. Hierarchy decides whether the dashboard is loved or merely tolerated.
Next Steps
Add anomaly detection, threshold-based alerts and a mobile companion view for on-call rotations.
Want something
like this?
Continue